How to Use Purchase Cohorts
The Purchase cohorts report shows how many first-time buyers come back to buy again. Open More, then Reports, then the Purchase cohorts tab. Choose the First purchases range (Last 6, 12 or 24 months, or Custom) and a Follow-up window (30, 60 or 90 days, or Custom to enter a number of days). The summary cards show First-time buyers, Repeat buyers, Repeat orders and Repurchase rate. In Monthly cohorts, click a First-time buyers number to see the contacts in that cohort (tick them and click Add tagging or Add to contact list to follow up), or click View purchases to see the orders. Use Columns and Filters to adjust the table, and Export for Download as CSV or Print. In Cohort trend, use Chart metric (Repurchase rate, Repeat buyers, Repeat orders, First-time buyers or Repurchase amount) and Show as table. Use Rank by and Cohort in Top packages on repeat orders.
You can use the Purchase cohorts report to see how many of your customers come back to buy again. It groups your contacts by the month of their first purchase (a cohort), then counts how many of them bought again within a follow-up window that you choose.
The report is built from purchases logged in Strive, for example with How to Log Purchase in Inbox. Each contact is placed in the month of their first order that the report can see.
1. Open Purchase cohorts
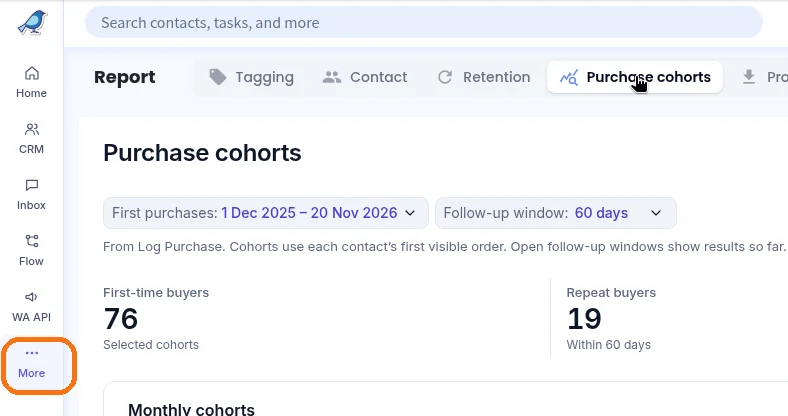
Click More in the left sidebar.
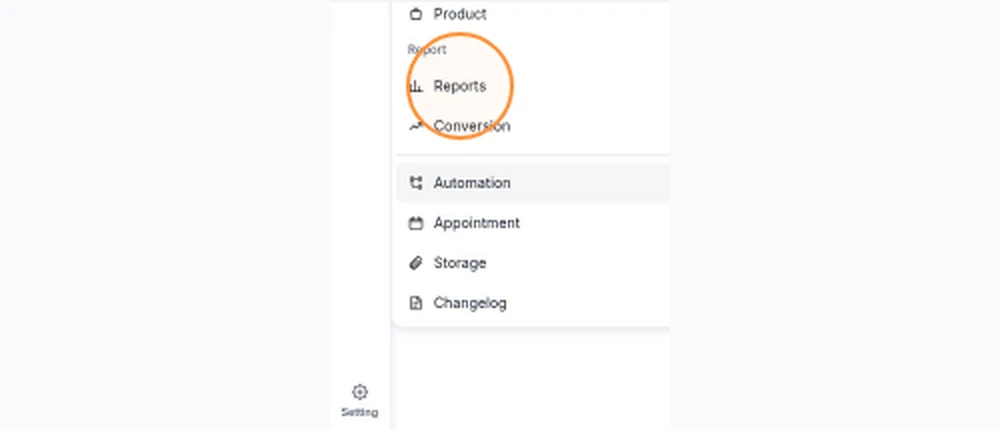
Under Report, click Reports.
Click the Purchase cohorts tab.
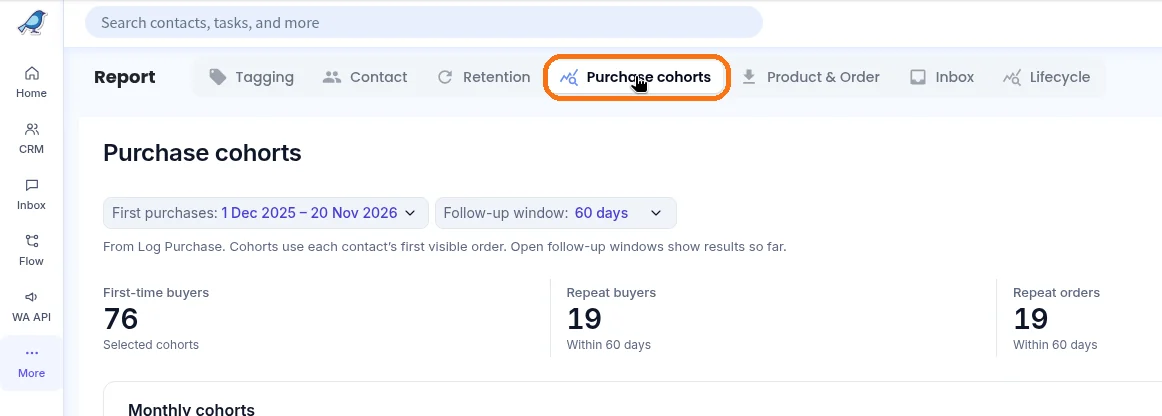
The report opens at strive.asia/report_module. The date at the top right (Through and a date) shows how recent the figures are.
2. Choose the first purchases to include
Click First purchases.
Choose a preset (Last 6 months, Last 12 months or Last 24 months), or choose Custom to pick your own dates. The dates each preset covers are shown next to it.
If you chose Custom, pick a From date and a To date on the calendar (choose a start date first, then an end date), then click Apply. Click Cancel to leave without changing the dates.
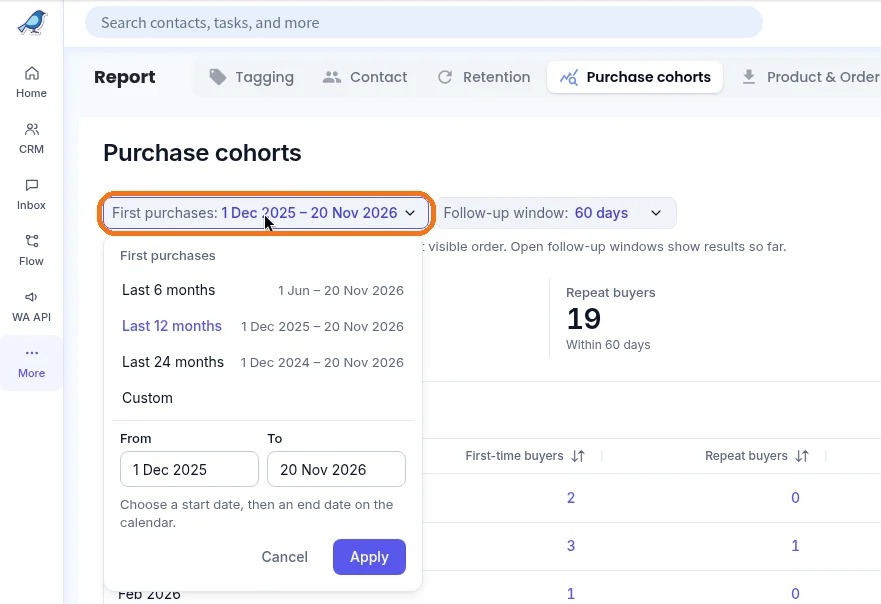
Only contacts whose first purchase falls in this range are included in the report.
3. Choose the follow-up window
Click Follow-up window.
Choose 30 days, 60 days or 90 days, or choose Custom… to set your own number of days.
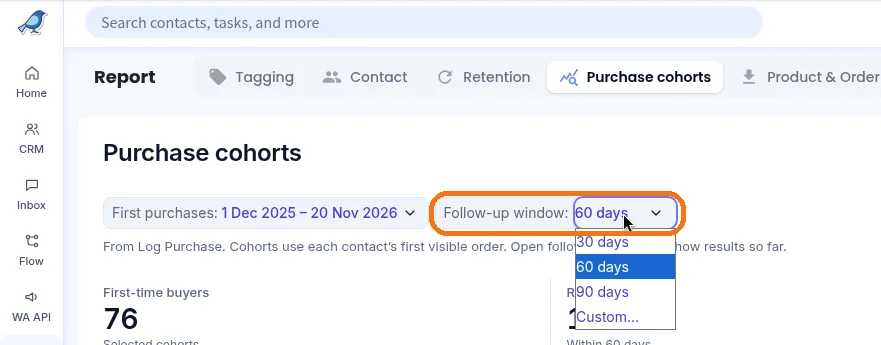
If you chose Custom…, the Custom follow-up window dialog opens. Under Number of days, enter how many days after each contact's first purchase to count repeat purchases, then click Apply. Click Cancel to close it without changing the window.
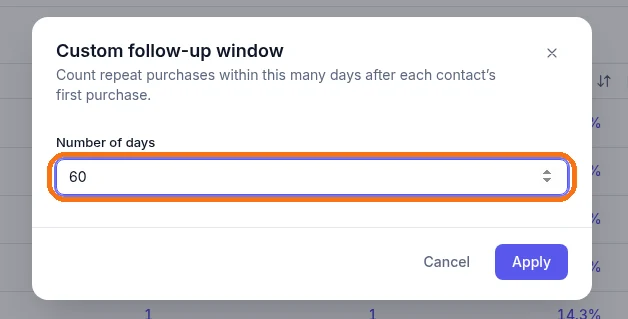
The follow-up window is how long after a contact's first purchase Strive looks for another purchase. A purchase counts as a repeat only if it happens inside this window. When you change the window, the numbers in the report update.
4. Read the summary cards
The four cards at the top add up the cohorts you selected:
First-time buyers: how many contacts made their first purchase in the range you chose.
Repeat buyers: how many of those contacts bought again within the follow-up window.
Repeat orders: how many orders those repeat buyers placed within the window.
Repurchase rate: the share of first-time buyers who bought again within the window. For example, 19 repeat buyers out of 76 first-time buyers is 25.0%.

5. Read the Monthly cohorts table
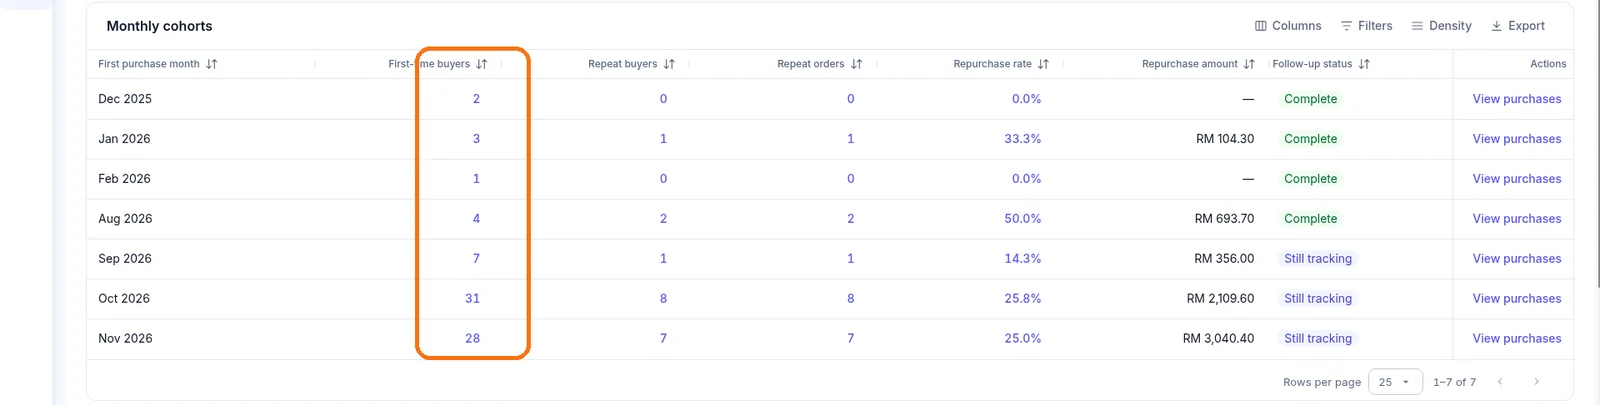
Under Monthly cohorts, each row is the month in which contacts made their first purchase. The columns show:
First-time buyers: contacts whose first purchase was in that month.
Repeat buyers and Repeat orders: how many of them bought again, and how many orders they placed, within the follow-up window.
Repurchase rate: the share of that month's first-time buyers who bought again.
Repurchase amount: the total amount of those repeat orders. A dash means there were none.
Follow-up status: shows Complete or Still tracking for each month.
Complete means the follow-up window for that month has ended. Still tracking means the window is still open, so those figures can still change as more time passes.
The note under the filters says the same thing: open follow-up windows show results so far.
6. See which contacts are in a cohort
In the Monthly cohorts table, click a number under First-time buyers. A Contacts dialog opens with the list of contacts in that cohort. It lists each contact once, with their phone, email, first purchase date, and number of repeat orders. Only active contacts that you can access are shown.
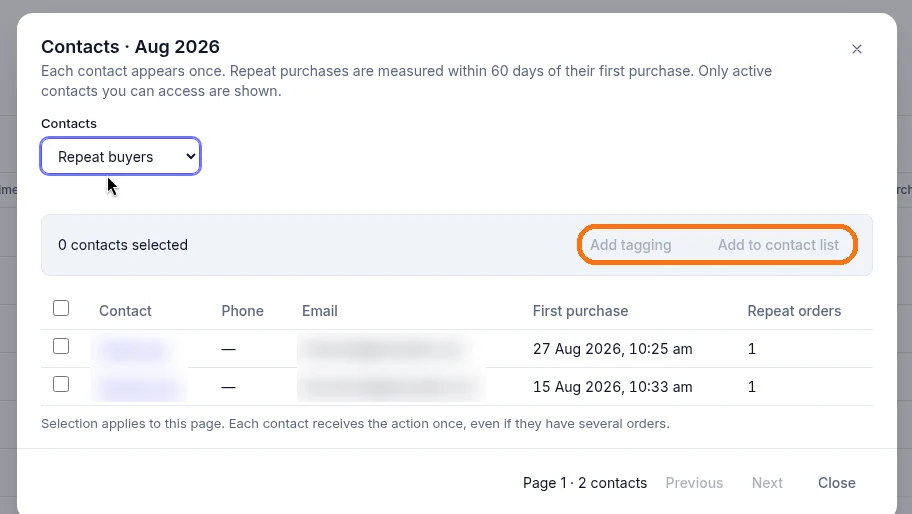
To change the list, click the Contacts dropdown and choose First-time buyers or Repeat buyers.
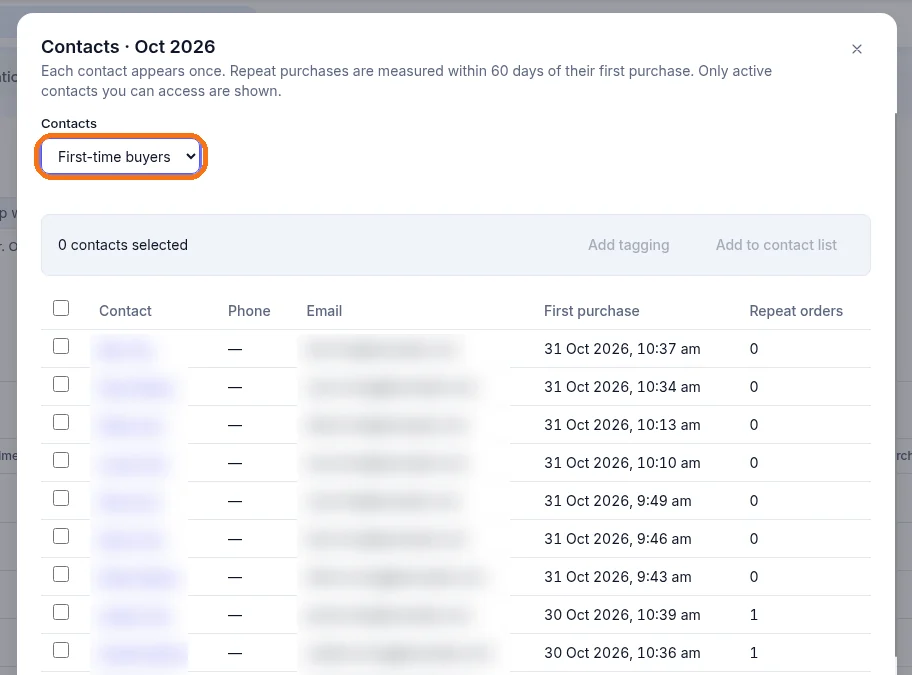
To follow up with these contacts, tick the ones you want, then click Add tagging or Add to contact list. These buttons stay greyed out until you tick at least one contact. The selection applies to the current page, and each contact receives the action once, even if they have several orders. Check who is ticked before you continue.
If there is more than one page, use Previous and Next at the bottom of the dialog.
Click Close when you are done.
7. See the orders behind a month
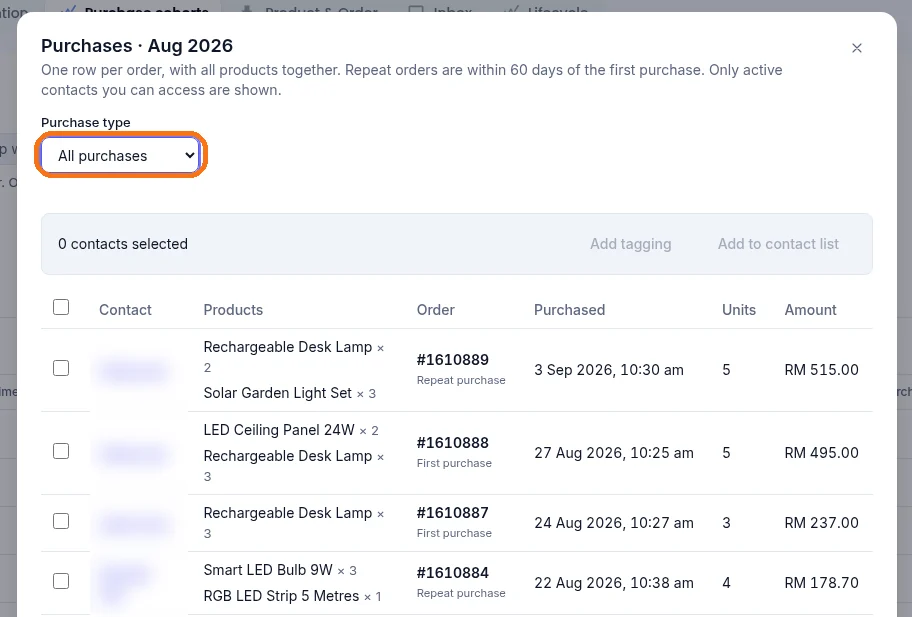
In the Monthly cohorts table, click View purchases on the month you want. A Purchases dialog opens with one row per order, with all of its products together.
Use Purchase type to show all purchases, first purchases only, or repeat purchases only.
Each order shows the contact, products, order number, purchase date, units, and amount, and is marked First purchase or Repeat purchase. You can tick contacts and use Add tagging or Add to contact list here too.
Click Close when you are done.
8. Change the columns, filter, and export the table
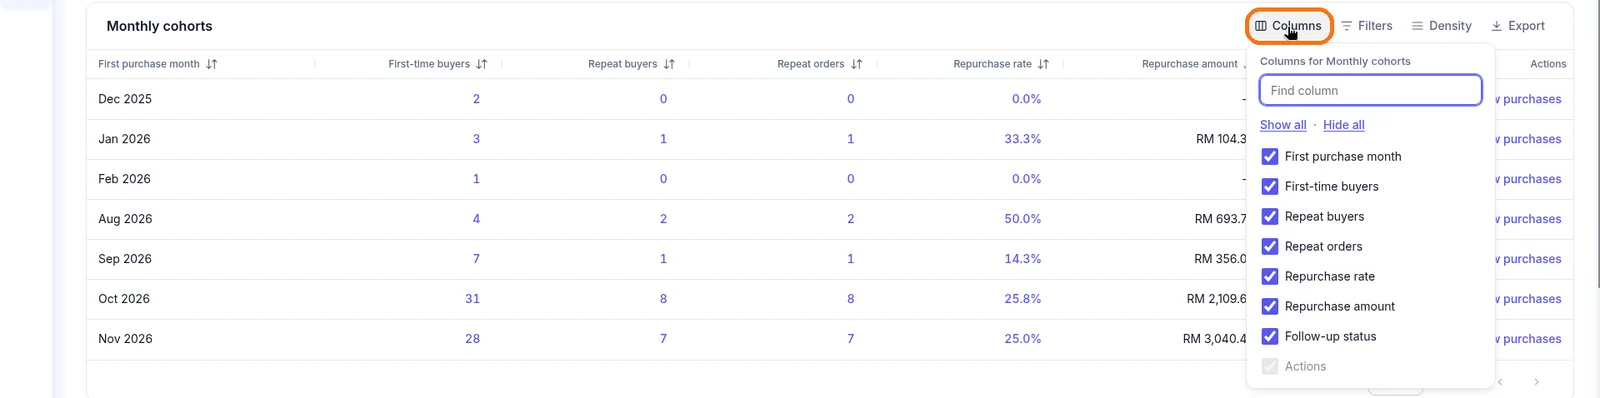
Click Columns above the table. Tick or untick a column to show or hide it, type in Find column to search, or click Show all or Hide all. The Actions column always stays on.
Click Filters to filter the monthly cohorts. Under Where, choose a column, choose a condition such as contains, then type a value. Click Add filter to add another rule, or Remove all to clear them.

Click Export, next to Columns, Filters and Density above the table. A menu opens with Download as CSV and Print.
Click Download as CSV to download the Monthly cohorts table straight away. The file has these columns: First purchase month, First-time buyers, Repeat buyers, Repeat orders, Repurchase rate, Repurchase amount, and Follow-up status.
Click Print to open the print view.
9. Check the Cohort trend
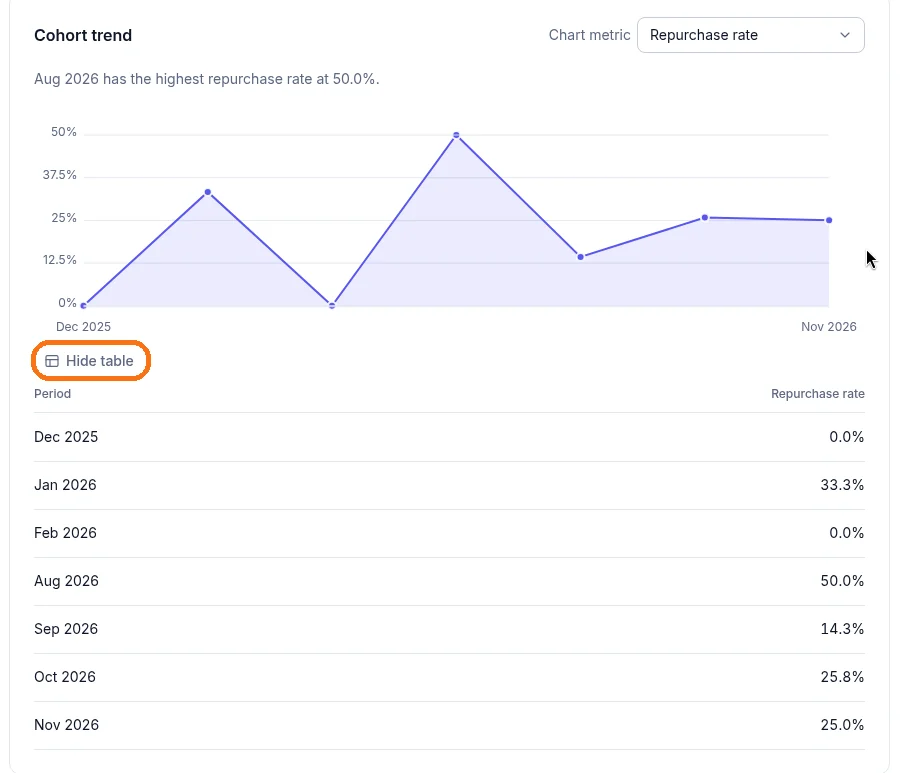
Below the table, the Cohort trend chart plots one point for each month. The line above the chart names the strongest month, for example "Aug 2026 has the highest repurchase rate at 50.0%."
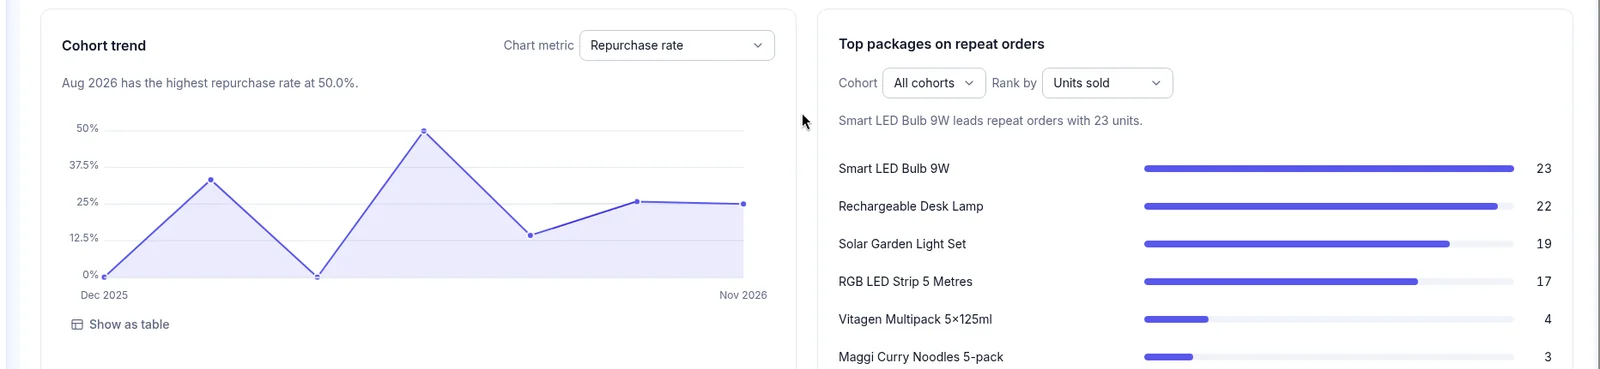
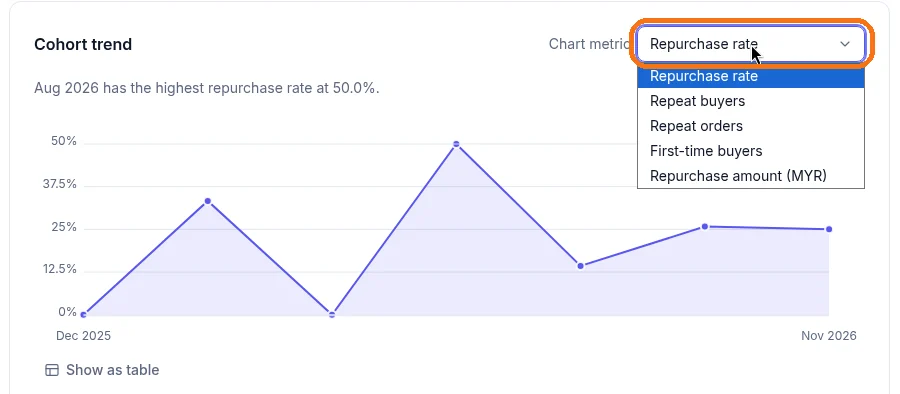
Click the Chart metric dropdown and choose what the chart shows: Repurchase rate, Repeat buyers, Repeat orders, First-time buyers or Repurchase amount (MYR). The line above the chart updates to match.
Click Show as table under the chart. A table appears below it, with each month under Period and its value for the metric you chose. Click Hide table to go back to the chart.
10. See the top products on repeat orders
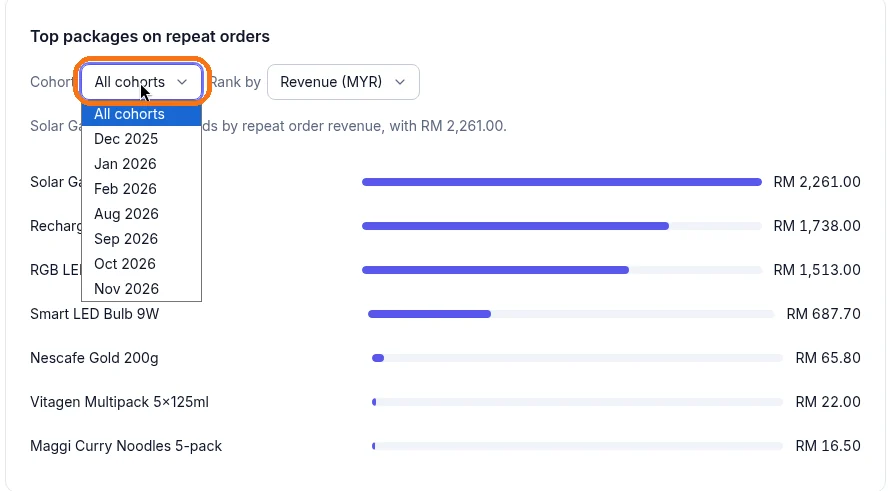
Top packages on repeat orders shows which products or packages your repeat buyers order most.
Click the Rank by dropdown and choose how to rank them, such as Units sold or Revenue (MYR). The bars and the line above the list update.
To look at one month only, click the Cohort dropdown and choose All cohorts or a month. The list then shows the top products on repeat orders for that month.